Building a visual consensus model
of the SARS-CoV-2 Life Cycle
How does SARS-CoV-2 enter and replicate in cells?
About the project
A significant and positive outcome of the COVID-19 epidemic is the speed at which many members of the biological research community have been able to redirect and apply their specialized skills towards an increased understanding of SARS-CoV-2. The rapid pace of publication and sharing of data, however, brings new concerns: what aspects of coronavirus biology are now well documented and understood, and what areas represent "black boxes" where there is inadequate research coverage or conflicting results? How trustworthy are the currently available data, and how close are we to having a consensus model of different stages of the SARS-CoV-2 life cycle?
This project takes a novel approach for enabling rapid and transparent communication of the research community’s knowledge about the SARS-CoV-2 life cycle. We are developing a web-based tool that combines a detailed animated molecular working model of different stages of the coronavirus life cycle with mechanisms for the research community to annotate and discuss aspects of the model. Users will be able to step through the animated life cycle model and annotate specific molecular elements, both in space and time. The annotations from the research community, which will be visible publicly, will serve to show shifts in our understanding of the viral life cycle due to emerging research, as well as help to develop updated visualizations -- including competing hypotheses -- that can be shared back with the research community. Ultimately, this project will result in a visualization of consensus model(s) of the coronavirus life cycle which can inform research communities as well as the public on our current understanding of the molecular mechanisms of SARS-CoV-2 viral infection.
What data did we use to create the animation? Have any questions or comments about what’s shown?
We’ve created an interactive user interface that allows you to:
interact with the animation (pause the animation and click on structures to view associated annotations and comments)
see what data we used to create the animations (annotations, shown on the left side of the screen)
ask questions and make comments about what you see in the animation (please log in to make comments; comments are shown on the right side of the screen). Comments can include marks and drawings.
visualize annotations and comments made over the course of the animation (see markings underneath the play bar).
report on bugs and other issues (click on the bug icon in the top left corner).
Please also feel free to email Janet if you have any questions or concerns.
Stay tuned…
We will be creating a final animation depicting SARS-CoV-2 egress in the coming months.
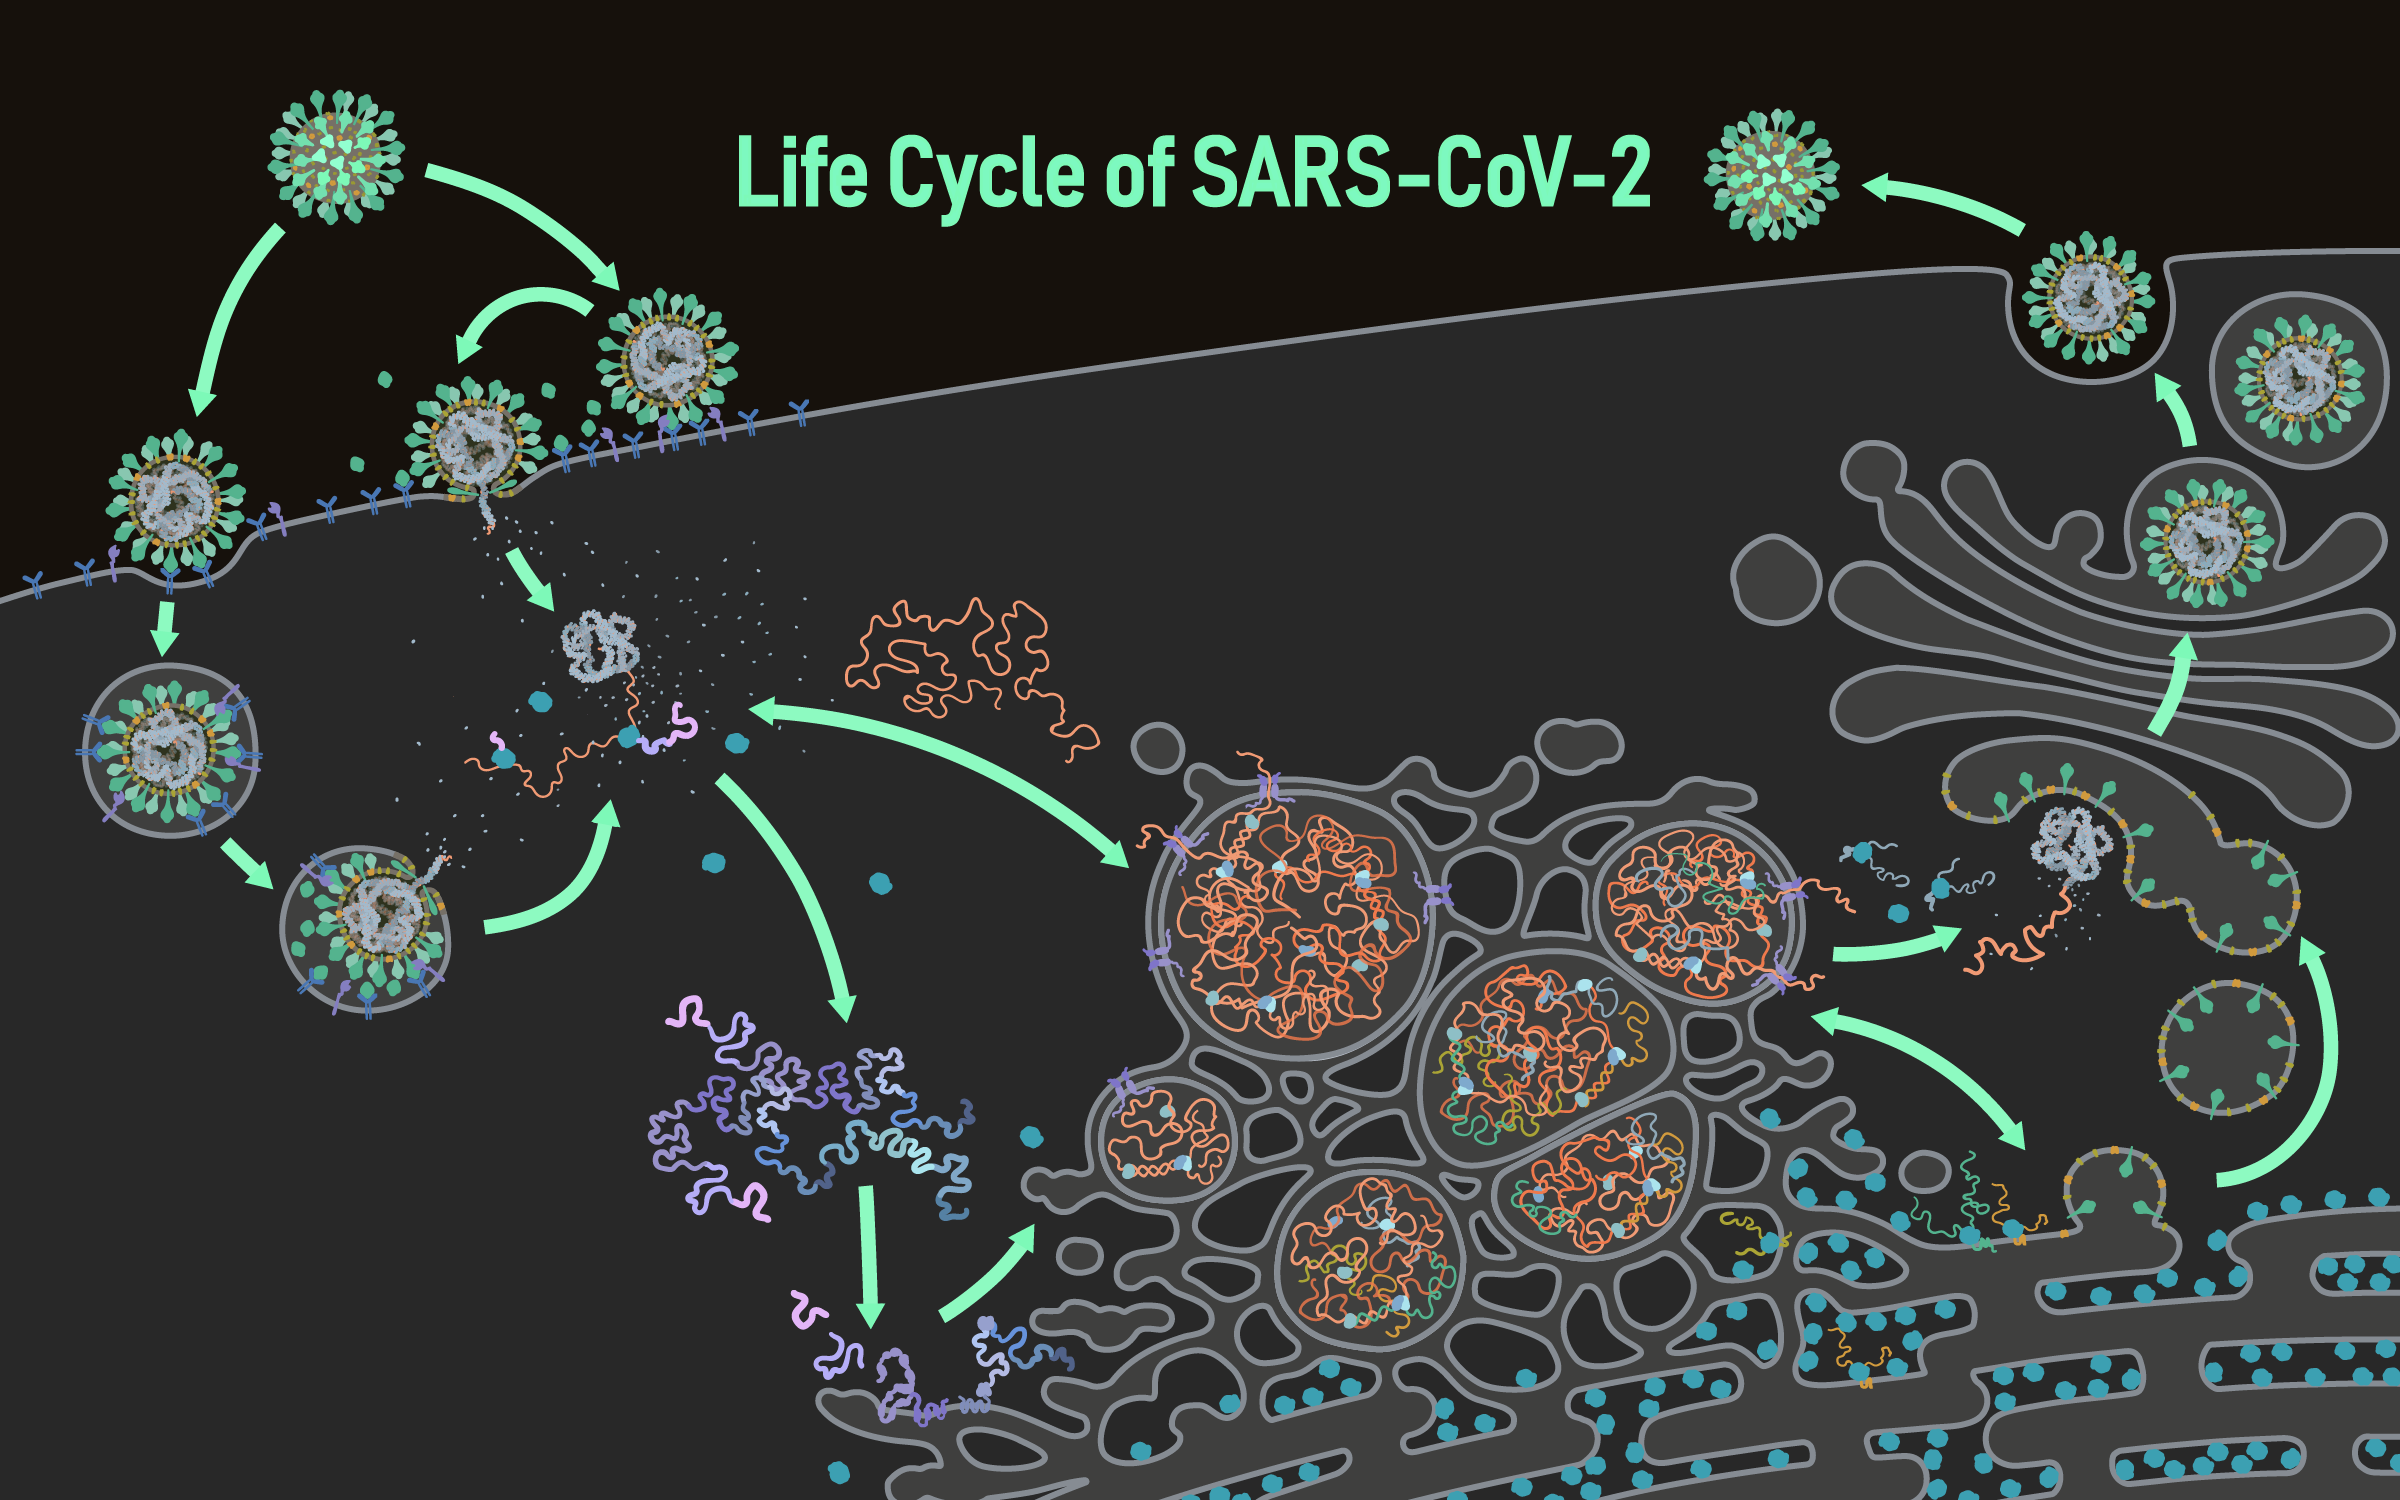
Illustration created by Ann Liu (Animation Lab)
Download the animation
Please check out the SARS-CoV-2 animation that is embedded in the annotation and commenting tool. If you’d like to download the animation or view it outside of the tool, please check out the SARS-CoV-2 entry animation on Vimeo.
The team
Janet Iwasa, co-PI, Animation Lab
Miriah Meyer, co-PI, Visualization Design Lab
Alexander Lex, co-I, Visualization Design Lab
Jen Rogers, graduate student (Visualization Design Lab)
Ann (Hui) Liu, postdoctoral fellow (Animation Lab)
Margot Riggi, postdoctoral fellow (Animation Lab)
Acknowledgements
This project is being completed in collaboration with the Coronavirus Structural Task Force with support provided by the National Science Foundation, the German Federal Ministry of Education and Research and the University of Utah’s 1U4U Initiative.


